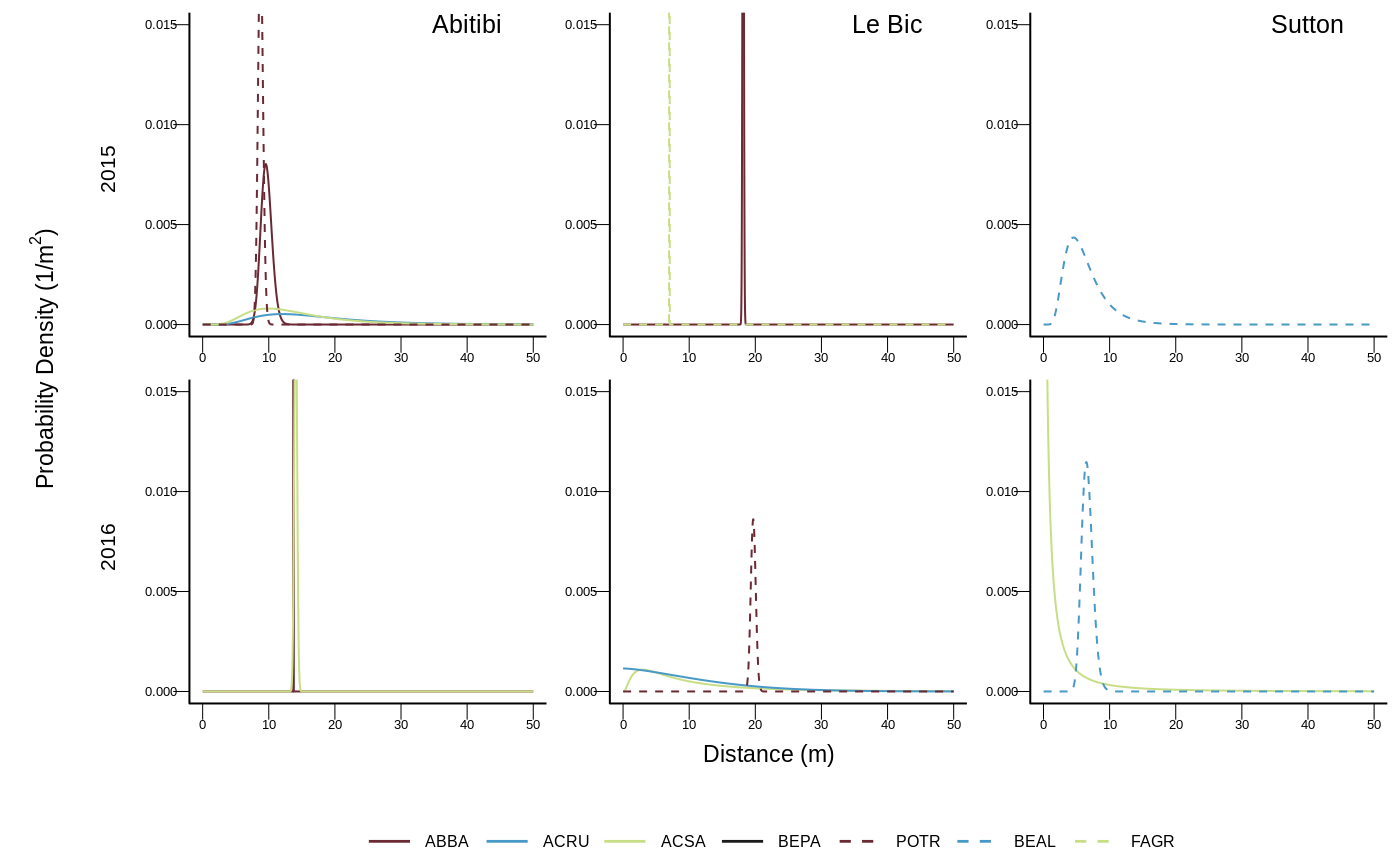
Draws kernels of the best models.
figKernels(datares, age = 1, xlim = c(0, 50), ylim = c(0, 0.015),
  colors = c("#6b2934", "#4899c7", "#c8de86", "grey10"))
Arguments
| datares | a data frame that contains the best models. |
|---|---|
| age | age of the seedling for which the figure is drawn (either 1 or 2). |
| xlim | numeric vectors of length 2, giving the x coordinates ranges. |
| ylim | numeric vectors of length 2, giving the y coordinates ranges. |
| colors | vector of colors. |
Examples
figKernels(res_bestModels)